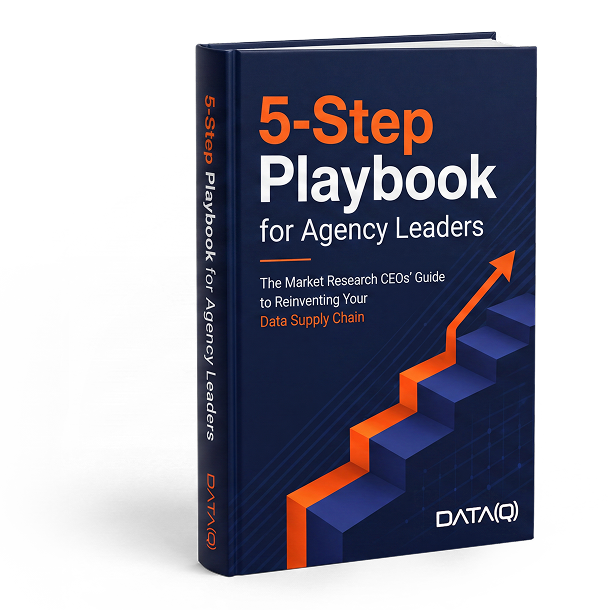
3D book cover titled '5-Step Playbook for Agency Leaders' with a subtitle 'The Market Research CEOs' Guide to Reinventing Your Data Supply Chain' and an orange upward staircase arrow graphic, published by DATA(Q).

Reinvent Your Market Research
Agency's Supply Chain For An Agentic Future

Go from disconnected data files to AI-ready, decision-grade data that is verifiable, traceable to source and ready for immediate distribution

3D book cover titled '5-Step Playbook for Agency Leaders' with a subtitle 'The Market Research CEOs' Guide to Reinventing Your Data Supply Chain' and an orange upward staircase arrow graphic, published by DATA(Q).

Your Reinvented Survey Data Supply Chain

We're always looking for ways to improve the results we deliver to our clients which is why we're building on DATA(Q) infrastructure to reinvent our processes and delivery for an agentic future. It gives us decision-grade data with built-in governance, a verifiable provenance and meaning layer, and outputs ready for modern data environments, systems, and AI.

Smiling woman with shoulder-length brown hair and black geometric glasses wearing a yellow blazer, white top, and a silver pendant necklace on a plain white background.
Elisa Adams
CEO, Sprout Strategy
2026 ESOMAR Awards Judge • 2025 ESOMAR Award Winner
Having the configurability of the DATA(Q) infrastructure to implement data designs and analysis pipelines that are decision grade and Agentic AI ready, has provided us the flexibility to be system agnostic and to future proof our operating model, at a fraction of the cost of a custom build, and without the accumulation of technology debt.

Smiling man with short dark hair wearing a checkered blazer and a white collared shirt against a white circular background.
Daniel Lord
Group Commercial and Technology Director

Our Offering
WORK WITH US

We partner with the leadership teams of market research and consumer insights agencies to help them drive strategic outcomes through technology.
ASSESSMENT

Do You Meet Decision-Grade Data Requirements?

Assess your data foundations before investing further in technology, AI and automation.
Book a call with an expert
TECHNOLOGY STRATEGY & IMPLEMENTATION SERVICE

The Zero-Risk Strategic Path to Value in 18 Weeks

A proven four-phase engagement model that takes your CEO and leadership team from first contact to full technology onboarding in 18 weeks. Structured to address their unique needs, de-risk their decision at every stage and guarantee value.
Book a call with an expert
CONSULTATION

Need Expert Advice on Your Supply Chain?

Meet with our experts to assess your data foundations, technology infrastructure and governance, and identify the structural gaps in your data supply chain standing in the way of AI-readiness. We'll discuss your strategic goals, create a "build, buy, partner" technology framework, and define your most critical initiative for the next 6 months.
Book a call with an expert

THE ZERO-RISK STRATEGIC PATH TO VALUE IN 18 WEEKs
From Underprepared to Reinvented

A proven four-phase engagement model that takes your CEO and leadership team from first contact to full technology onboarding in 18 weeks.

01. Discovery and Alignment

Strategy Session

Solution walkthrough

Business outcomes workshop

Investment overview

Weeks 1-3

02. Proof of Value

Free 4 Week Pilot

Weeks 4-7

03. Executive Decision

Business case presentation

Week 8

04. Value Realization

Risk-free Go-live

Weeks 9-18


Client USE CASE

This market research agency reinvented their survey data supply chain to create a governed data pipeline, automated process and flexible, AI-ready decision-grade data outputs.
Diagram titled 'Before - No Data Infrastructure Layer' showing three columns representing siloed workflows with no single data source, human data reconciliation work, and more work required for each output. The left column lists elements like questionnaire library, templates in Word, final questionnaire, code frames, hosting platform, and raw outputs. The middle column shows data reconciliation tasks like reconciling data meaning, syncing reference files, reformatting data, creating variables, managing codes, creating scripts, merging, and stacking. The right column lists output formats such as CSV, SAV, Q-Ready files, crosstabs, PowerPoint, Displayr, BI tools, and dashboards, with dashed lines connecting related tasks and data sources across columns, illustrating fragmented and manual processes.
Flowchart illustrating a robust data infrastructure layer process: starts with a questionnaire database containing a questionnaire library and templates, proceeds to DATA(Q) as the single source of truth combining final questionnaire and data blueprint into metadata, then moves to a hosting platform, followed by DATA(Q) attaching meaning to data returns ensuring clean, correctly labeled respondent-level data, and ends with automated preparation for distribution into various formats including JSON/JSONL, CSV, SAV, Parquet, Q-ready files, Crosstabs, Displayr, BI tools, Dashboards, API, MCP, Data Lake, Data Warehouse, and Data Lake House.

Deep Industry Experience
60 years of combined domain expertise

Middle-aged man with short graying hair and glasses wearing a light blue button-up shirt, looking thoughtfully to his right against a plain light background.

Peter Kloprogge

linkedIn icon
Smiling woman with long red hair wearing a blue patterned blazer over a white top and a long gold chain necklace against a white background.

Roxan Toll

linkedIn icon
Portrait of a young man with short black hair wearing a black t-shirt, looking directly at the camera with a neutral expression on a plain white background.

Richard Yang

linkedIn icon

Experience leading at

THOUGHT LEADERSHIP PIeces

3D book cover titled '5-Step Playbook for Agency Leaders' with a subtitle 'The Market Research CEOs' Guide to Reinventing Your Data Supply Chain' and an orange upward staircase arrow graphic, published by DATA(Q).

Reinvent Your Market Research Agency’s Supply Chain for an Agentic Future

Go from disconnected data files to AI-ready, decision-grade data that is verifiable, traceable to source and ready for immediate distribution


3D book cover titled '5-Step Playbook for Agency Leaders' with a subtitle 'The Market Research CEOs' Guide to Reinventing Your Data Supply Chain' and an orange upward staircase arrow graphic, published by DATA(Q).